We’re into Week 4 of a 5-part blog series where I’ve been reviewing the key components of category management, followed by surveys where Retailers evaluate how well they are doing in the different components.
Last week’s evaluation related to the category tactics – product assortment, shelving, price and promotion. The overall participants included small to mid-sized Retailers (large Retailers were a low number of respondents and were extracted from the results so that we could draw more consistent conclusions). Even if you haven't participated in the surveys over the past few weeks, these new results are quite compelling, so let’s take a look —
Overall survey results (Topline View)
This week we’ll address the survey results a little differently because each of the tactics need to be tied in with more strategic considerations from a Retailer perspective. Following are the topline results from last week’s survey on the tactics. Recall that these results are for small- to mid-sized Retailers, with a “1 = weak” and “5 = strong” score across different areas that relate to the tactic.
|
|
Average Rating* |
Overall Results |
Participant Comments |
|
Product Assortment |
1.7 |
Lack of strategy and processes, limited data, and little or no training were the lowest rated areas in assortment. |
“We have an opportunity to create consistent and effective tools to quickly complete assortment analysis for our most important categories”. |
|
Shelving |
1.4 |
Lack of strategy, limited access to planograms, and limited resources to complete shelving work were the lowest rated areas in shelving. |
“Find ways to make simplified strategic shelving choices that don’t require us to create planograms”. |
|
Pricing & Promotion |
2.6 |
Ratings were much higher in strategy, processes and analytics for Pricing & Promotion. Lack of automated processes and data were rated lowest. |
“We have strong analytics on pricing and promotion, but don’t go back and evaluate the effect of promotions or lower prices on lift in sales or profit.” |
In general, it appears that some Retailers struggle with the tactics (including strategy and analytics), and in particular, with product assortment and shelving.
Tactical Considerations
It’s interesting, but not surprising, that pricing and promotion scored higher overall than product assortment and shelving. Think about what Retailers are trying to accomplish as an organization – to increase sales and profit (which is what most companies work to do). I want to relate the tactical survey results with the retail income statement, because it helps to explain why most Retailers are better at developing strategy behind pricing and promotion than assortment and shelving.
HOW DO YOU INCREASE NET MARGIN IN A CATEGORY?
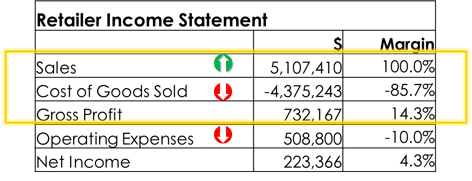
Here’s a basic retail income statement:

Retailers can influence net income by:
- Increasing Sales. The tactics (including assortment, shelving, pricing and promotion) are what drive sales in a category. The quickest way to increase sales is to run an ad or reduce prices but this approach can also can play havoc on Retailer profit. Because it’s more work and requires focused effort to increase sales by completing assortment analysis, eliminating unnecessary SKUs, creating planograms and executing in-store. The results from assortment and shelving changes are also hard to see, because they aren’t tied into the key data that’s extracted from retail point of sale data … out of sight, out of mind?
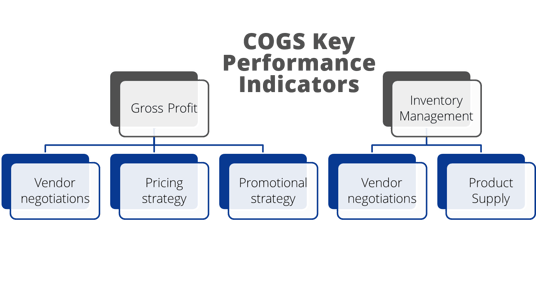
- Reducing Cost of Goods Sold (COGS): COGS is simply that – the cost you paid to get the products on the shelf. There are two areas where you can influence COGS – gross profit and inventory management.

a. Gross Profit: Retailers can affect Cost of Goods Sold through pricing and promotional strategies. This is where they spend much of their time in Vendor negotiations, ultimately trying to find the right balance between retail price and getting unit cost as low as possible. Once again, these numbers are easy to see in retail point of sale data and typically have strong KPIs behind them.
b. Inventory Management: Retailers can influence inventory by the amount of product they have in their warehouses and in their stores (in the back room and on the shelf). The cost of the merchandise purchased but not yet sold is reported in the Retailer’s inventory as part of the accounting process, and considered to be a financial asset for the company. It ties up a Retailer’s money, affects cash flow, and limits the ability for a Retailer to put the money towards more productive investments.
Inventory management is directly affected by product assortment and shelving changes. If you have unproductive products on the shelf you are tying up inventory that isn’t selling. Or if the product has too much space or too little space you may have overstock or out-of-stock issues. Once again, difficult to access some of these numbers and correlate them with COGS.
If you’d like to learn more about retail economics, check out our video below:
In net, perhaps the stronger strategies, analytics and overall understanding of the pricing and promotion tactics are a result of higher visibility and are easier to execute than assortment and shelving. Also, many of the overall KPIs for Retailers tie in more directly with pricing and promotion because of some of the things covered above.
We’ve now evaluated some of the key areas related to retail strategy, overall category management process, category assessment and the category tactics, and highlighted the areas of opportunity for each.
The opportunity for you, as a Retailer, is to improve your strategic approach and analytics from where you’re currently at. Don’t try to fix everything at once because it’s overwhelming and often ineffective. Your strategies and analytics can be basic to start with, driven by the size of your business, the data and resources you have available, and the level of sophistication that you want or need.
Next week I’ll cover details about ways you can build a more strategic approach to your retail business using a category management framework.
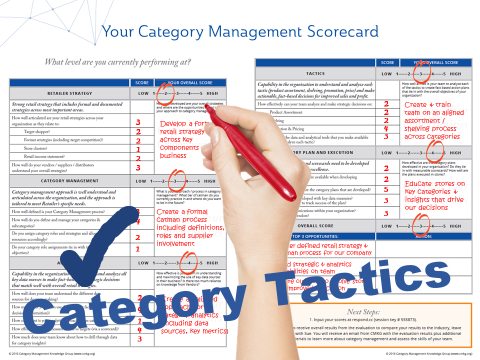
 Rather than an online survey, this week we are offering a Downloadable Retail Scorecard that you can complete on your own or with your team. Use it as a starting point to help identify where you should be focusing your efforts in a quest for continual improvement. In the end it will help you get started on achieving your overall business results.


