Common (Mis)Interpretations:
Category Development Index in Category Analysis
There is significant emphasis on deriving effective and strategic insights in category management. With all of the incredible data sources available to both Retailers and Suppliers / Manufacturers, there are certain measures that are consistently used to derive these insights.
For some of the commonly used measures, there’s also a tendency to generalize the interpretation of the numbers, or not scratch below the surface and think about what the numbers really mean. Examples? Category Development Index (CDI) and Fair Share Index (FSI) …
Too often, not much thought goes into how most people interpret an index. If you are worried you might be on the wrong path when it comes to interpretation, I’ve compiled some good resources for you —
- How to draw relevant observations from CDI and FSI - complimentary infographic download
- Category & Business Insights 1 & 2 - Two Skill Development Training Programs available for purchase from CMKG
To begin, an index compares two numbers, for example:
-
Index vs. Year Ago = $ Sales This Year ÷ $ Sales Last Year x 100
-
Index vs. Target = $ Sales ÷ $ Target x 100
An index is a very helpful number to understand when analyzing data. The problem can be in the interpretation of an index, which tends to get generalized. For example, >100 is “good” or “overdeveloped” and <100 is “bad” or “underdeveloped”. But there are many indices in category management that should be more thoughtfully interpreted. Let’s review some of these in more detail.
What is the Category Development Index (CDI)?
Category Development Index Calculation is as follows:
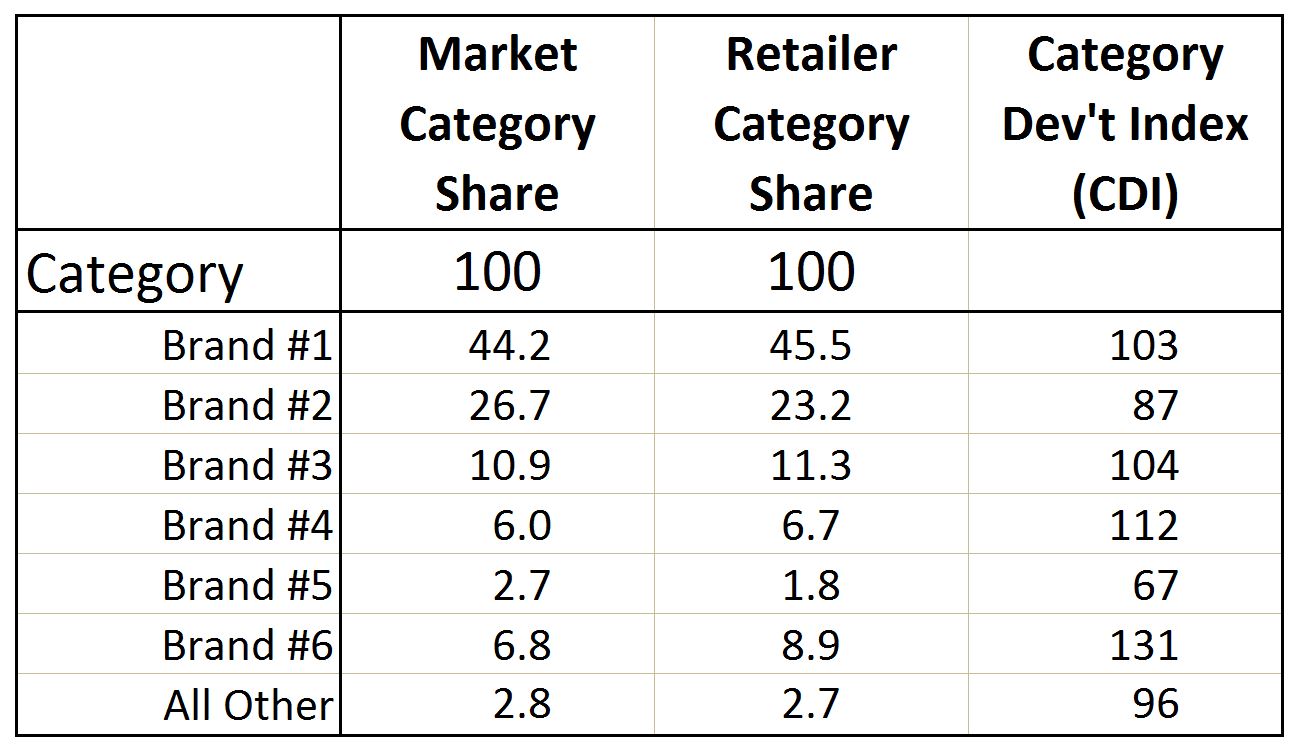
Brand or Segment Share at Retailer ÷ Brand or Segment Share in Market x 100

The index above compares the Retailer’s share of a Brand or Segment to a Market’s Share. If an index is below 100, the common interpretation is:
Brand #2 is underdeveloped, and you need to turn this around.
If the index is above 100, the quick interpretation is:
Brand #1 is overdeveloped, and you need to give it less support.
What’s wrong with this? The problem is that this index does not tie into the Retailer’s strategies or consider what they are trying to accomplish in the category. Read my previous post on circumstances for thinking about Retailer Market Share.
What is Fair Share Index (FSI)?
Fair Share Index Calculation is as follows:
Brand or Segment Tactic Share ÷ Brand or Segment $ Share
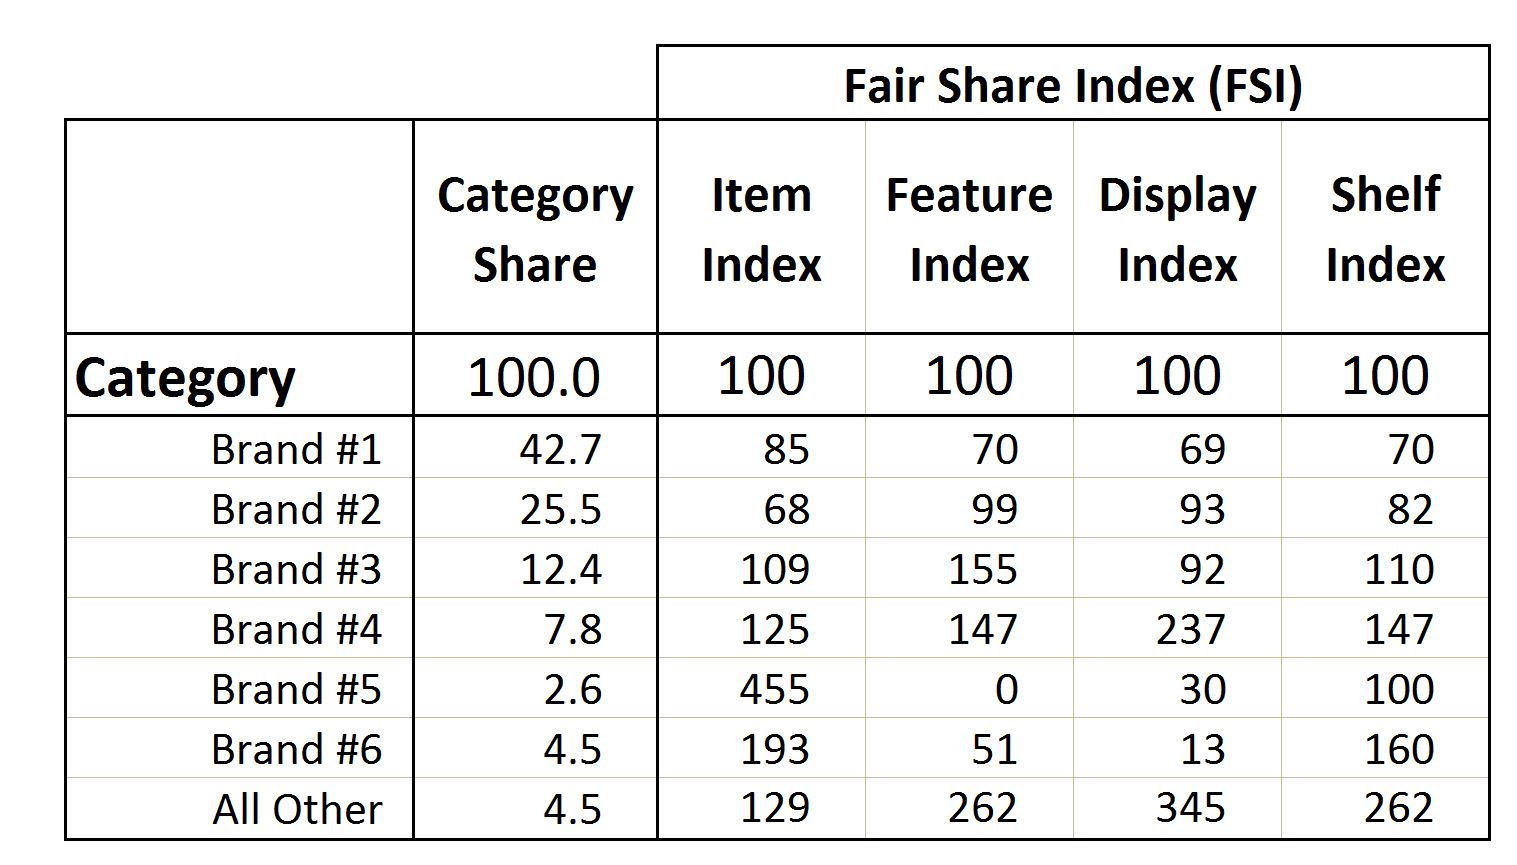
The Fair Share Index (FSI) compares the Retailer’s share of a Tactic (either shelf, promotion, display or items) with their Category $ Share at a Brand or Segment level.

A common complaint from a Supplier / Manufacturer to a Retailer is:
I’m not getting my fair share of <items> or <feature> or <display> or <shelf> in the category.
This conclusion comes from the FSI calculation. In the example above, Brand #2 is not getting its fair share of any of the tactics, because all of the indices are below 100. But as in the CDI example, Retailers need to think beyond the index and consider what they are trying to accomplish with each brand.
For example, Brand #2 (which is the value brand that competes with their Private Label brand) has indices below 100, but they are higher than Private Label (Brand #6) in feature and display, and higher in all four of the tactics than Brand #1 (a more premium national brand). So this Retailer should be concerned that the FSIs are high on Brand #2. They should consider allocating more feature, display and shelf to Brand #1 and more display to Brand #6.
Based on a specific target consumer and goals for the category, Retailers need to be strategic about which brands and segments they want to have the highest FSIs in.
What is the Index vs ACV Measure (All Sales Share)?
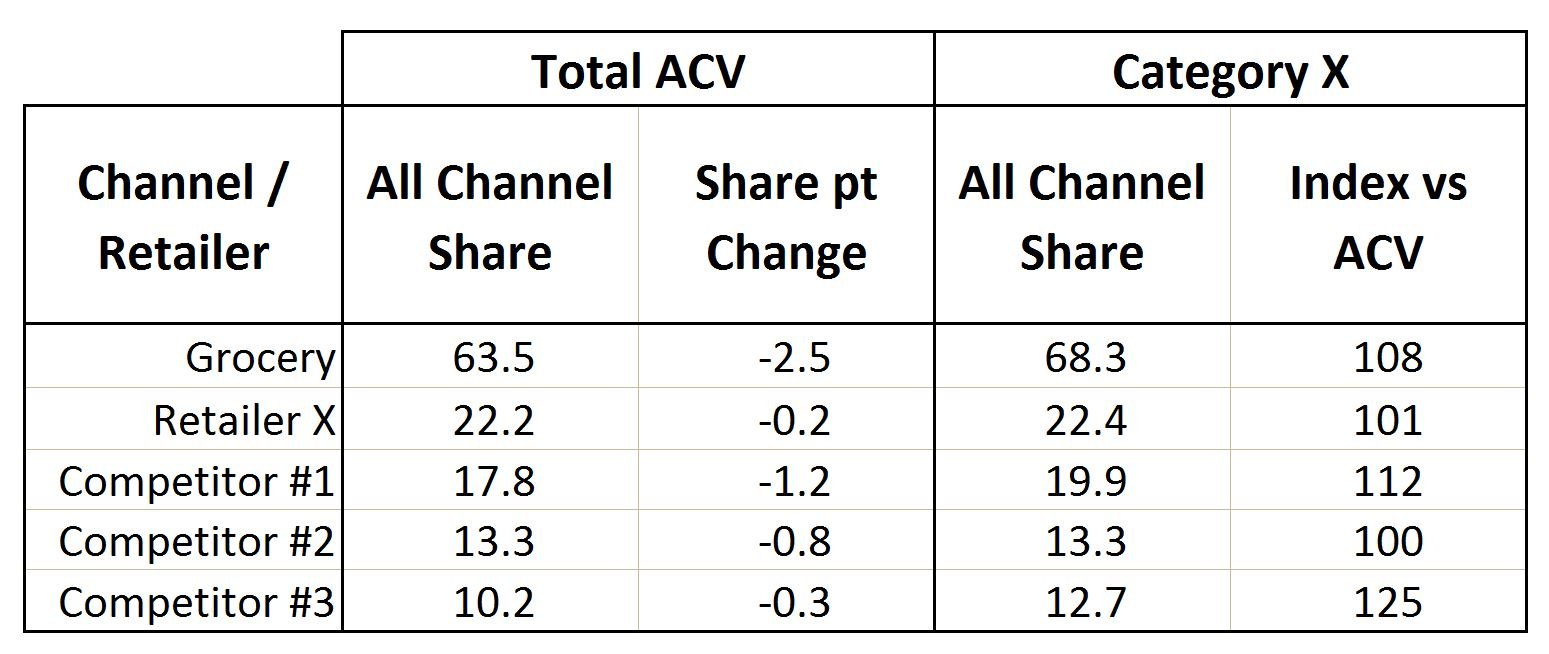
Retailer Category Share of Market ÷ Retailer All Sales (ACV) Share of Market
The Index vs ACV measure is typically used to identify the most and least developed categories and their corresponding volume opportunity gaps through Nielsen syndicated data or panel data.

Retailer X has an Index vs ACV of 101, so without seeing the other comparative indices vs channel and competition, the interpretation may be that Retailer X is strongly developed in Category X. But when you compare Retailer X to Grocery and three competitors, the numbers above indicate a huge opportunity for Retailer X to increase development in this category. So they may choose to create a target share in Category X that is 25.0 (vs current 22.4), to further develop this important category.
Once again, digging deeper into the numbers gives a much better perspective of opportunities in the category. This information could be explored further to understand Retailer X’s development within segments and brands in this category.
THE OPPORTUNITY?
-
RETAILERS: Create strategic benchmarks for your indices (CDI, FSI, ACV) that will help you achieve your category targets and goals. Don’t aspire to be at 100 which is “at par” with the rest of your market. You have unique Shoppers and strategies. Take action on creating more strategic benchmarks.
-
SUPPLIERS / MANUFACTURERS: Stop focusing on what you aren’t getting and start thinking strategically about why a Retailer wants to be strongly developed in your brand as a part of their total category solution to satisfy their unique Shoppers.
If you need more work in this area, we have customizable category management learning options for both Individuals and Teams:
Compare Individual Learning Options in Category Management Training
- Á La Carte Courses
- Skill Development Programs
- Certification Programs
- On-Demand Learning
Find out why off-the-shelf training doesn’t fit all Teams and Organizations
- Corporate Category Management Training options for teams starting at 5 individuals that helps your team collaborate, meet goals, and get ahead of the competition.


