So you’ve experienced a sales or share growth or decline and want to understand what drove those results.
This search for cause is something that happens in our business all of the time. The typical place to look is in your scanned sales or key account/market data. But did you check your household panel data? If you didn't, you won’t know what consumer behavior is driving the increase or decrease in sales. In net, sales are driven by how many households buy your product and how much each household spends – the only place that you can get this information on a regular basis is through household panel data (also known as consumer panel data, panel data or Homescan data). This is an incredibly important perspective in our Shopper-centric category management world.
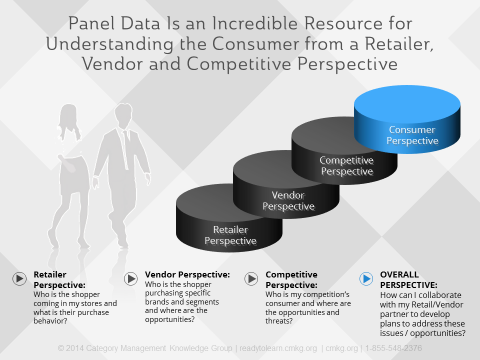
Panel data is a data source for both Retailers and Vendors to get a clear picture of consumer behavior and their shifting trends, including shopping households, their purchase behaviors, who they are, where they shop and what they buy (and what else they buy). Sometimes we get so caught up in point-of-sale and retail measurement data and we forget to look at consumer panel data. This consumer-focused data source gives us insights into the impact of marketing initiatives on consumers’ attitudes, behavior and sales.
Here are some resources to help you build your skills in Consumer Panel Data Analysis:
- Free Download: What is Household Penetration and How Do You Use It?
- Course Video Preview: Building Data Competency: Panel Data
- Course Overview: Building Data Competency: Panel Data
Before I walk through a quick case study on dissecting sales results into consumer purchase behavior, I want to review a few important things about panel data that you need to know. Because panel data is not proprietary and can be purchased by Retailers and shared by Vendors, it is a great resource to get consumer insights. This data is key to giving a Retailer perspective, a Vendor perspective and a competitive perspective about the consumer across many different views of the data. This comparison helps us truly understand who the consumer is. This data source is also one that allows for collaborative efforts between Retailers and Vendors, as Vendors tend to have access to more robust panel data sets than Retailers do.
Where Does Panel Data Come From?:
Panel data comes from consumer panels, which include Nielsen and IRI household panels (through a shared data source called the National Consumer Panel (NCP)). Other consumer panels in other regions or industries may include mail surveys and Internet surveys. I’m not going to go into detail on how this data source is generated or the strengths and weaknesses of it, but it’s always important to understand this before you start working with any data source.
Types of Household Panel Data Analysis Available:
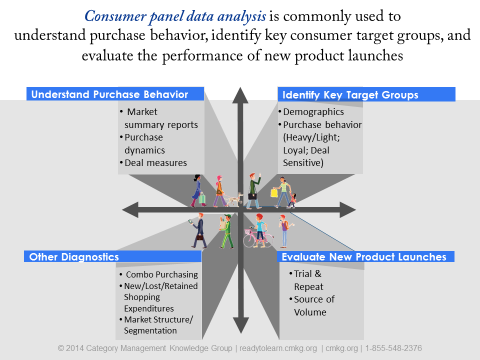
The most common types of analysis that can be done with household panel data can be classified in 4 main categories:
- Understanding Basic Purchase
- Identifying Key Target Groups
- Evaluating New Product Introductions
- Other Diagnostics (including Combination Purchasing, New/Lost and Retained Buyer Flow Analysis, Shopping Expenditures and Market Structure/Segmentation Studies)
Category Management Case Study
For our case study we are going to focus on “Understanding Purchase Behavior”. Here’s the scenario: Retailer A wants to understand what’s driving their share results in a specific category. They are losing market share in a category that is very important to them and want to make some changes. We’re going to analyze their results using household panel data to understand things from a consumer perspective.
How am I performing vs competition?
In our panel data we can determine if Retailer A’s decline was driven by a change in the # of Buyers who bought the product and/or by a change in Buyer spending. This is because
Total # of Buying Households (Penetration) X $ Spend Per Buying Household (Buying Rate or Avg $ per Household) = $ Sales
This is a very important formula to understand when analyzing panel data, because Penetration and Buying Rate are both measures available within household panel data. Here’s an example of penetration for our case study on Retailer A in their category results:
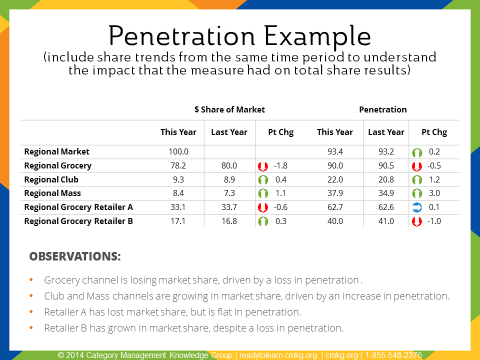
First, it is important to include the share trends from the same time period that you are looking at within your panel data. In this example, Grocery is declining, while Club and Mass are growing in $ share. Retailer A is losing share, and Retailer B is growing slightly in share within this category. When we look at penetration results (remember, that it relates to the # of households purchasing the product):
- Grocery is losing penetration, driven by loss of penetration in Retailer B. Retailer A’s penetration is flat.
- Club and Mass are growing in penetration, which is ultimately driving up penetration slightly, up 0.2 pts, in the total market.
- Retailer A is losing share, but penetration is flat, while Retailer B is growing in share, but losing penetration.
(Learn more about the penetration measure)
How Has Consumer Spending Affected My Share Results?
We want to understand how the $ being spent by Buyers is affecting the share results for Retailer A.
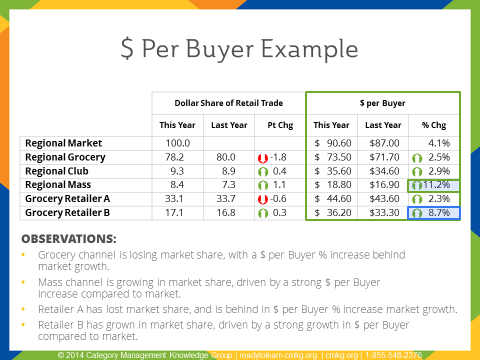
The average household expenditures have increased across all channels, as well as both retailers. When you look at the % increase, you can see that regional Mass, and Retailer B, increased the most in $ per buyer. Grocery, Club and Retailer A were behind the market growth of 4.1% in $ spent per buyer. The $ per buyer measure can be broken down even further into:
$ Per Buyer = # of Purchase Occasions X $ Per Trip
Drilling into this level of detail will give you the true consumer dynamics that are happening in the category for Retailer A, as you can see in the following example:
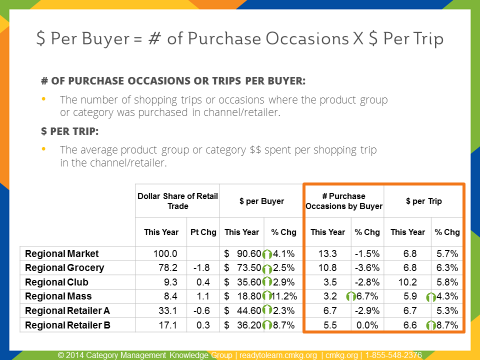
Mass is the only channel that has increased the # of purchase occasions AND the $ per trip. Retailer A’s # of Purchase Occasions has decreased by 2.9% and while their $ per trip have increased (as have everyone else’s $), they are behind the market growth of 5.7% and below their closest competitor who is up 8.7% in $ per trip.
Summary for Retailer A:
Retailer A has lost share in a very important category for them. Their Penetration is flat (the same # of households are purchasing the category in their stores) and their $ per buyer growth is behind all other channels and their key competitor. This is being driven by a loss in the # of Purchase Occasions by buyer and by a growth in $ per trip that is lower than Market and Competition.
Retailer A now has a much better understanding of how consumer purchase behavior has driven share loss in their category.
Action Plan:
The opportunity now is to integrate the insights from the panel data with Retailer A’s point-of-sale data to get a complete picture of what is happening across the tactics. Based on their loss in $ per buyer, the subsequent action plan should include ways to influence Retailer A’s consumers to:
- Purchase more frequently (increased # Purchase Occasions or Trips): Through vehicles like coupons, in-store displays, on-pack promotions, contests, promotions and advertising and limited time offers; and
- Increase their average purchase size (increased $ per trip): Through vehicles like “buy one get one free” offers, new product launches on the premium tier, multiple pricing (like buy 3 for a special price), multiple purchase coupons and large pack size displays.
The analysis provided above is some basic analytics that should be understood by teams and organizations who purchase or have access to panel data and are responsible for building sales and share for their categories and brands. This case study is only a fraction of the types of analysis that can be done using panel data. Data can also be available down to a brand and subcategory level for even further insights. Loyalty analysis, interaction analysis, demographics and heavy/light buyers are some of the other consumer perspectives that can be gleaned from this data source.
Looking for even more information to build your understanding on panel data? Category Management Knowledge Group can help you, your team or your organization learn more about Household Panel Data through our certified category management training programs.
Check out our accredited course on “Building Data Competency: Panel Data” or watch a video preview that includes additional learning by clicking the graphic below.
|
$125 USD 30-day Access Hands-On Downloadable Reference Guide Knowledge Checks Course Test |


