Being able to analyze data and derive relevant insights from it is a requirement in almost every role for both Retailers and Suppliers.
There’s an opportunity for many in our industry to learn how to make fact-based, strategic decisions and recommendations by building skills to effectively read and interpret data.
A great starting point for learning how to do this is through a category assessment.
Creating a category assessment is also the first step in developing a retail category plan, but the flow, measures and logic apply to development of category reviews, business reviews and internal planning documents.
You should be able to analyze, benchmark, interpret and identify strengths, weaknesses, opportunities and threats through an effective category assessment.
Here are some great resources for you to get started improving your data insights:
- Download Infographic on CDI and FSI to understand how to properly interpret Category Development Index (CDI) and Fair Share Index (FSI)
- Check out our accredited, online course on “Completing a Category Assessment”
- View our “Completing a Category Assessment” course preview
5 ways to improve your data insights:
The following tips will help you draw better insights from data—without knowing these things, your team may draw incorrect conclusions or lose credibility when using data.
1. Understand the strategies behind the analysis first.
You can’t properly assess what’s “good” or “bad” when completing any type of analysis if you don’t know what the underlying strategies are that relate to it. For example in a Category Assessment you need to understand what the Retailer is trying to accomplish and who their target Shopper is. This includes the definition, role and strategy of the category and the importance of the category to the target Shopper. It also includes the store clusters and an understanding of the differences within each cluster. Without this information you will have a hard time drawing relevant insights from the data.
2. Pull the right data.
Take the time to get the data pull right. Some of the most common measures and dimensions in a category assessment include:
- Volume: Units, Dollars and/or Tonnage
- Growth: % Change and Absolute Change vs Year Ago
- Share: Market Share, Category Share, Share Point Change
- Time Periods: Latest 52 wks, 26 wks, 12 wks
- Geographies: Retailer (and store clusters where appropriate) and Comparative Market
- Product: Total Category, Segments, Brands
3. Consider “growth” from different perspectives.
Regardless of what type of analysis you are doing, look at volume growth using 2 measures - % change vs year ago and absolute change. Looking only at % change limits your perspective on what’s driving category results, while absolute change quantifies the results.
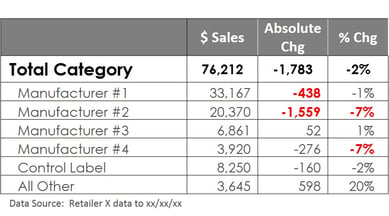
In the following example, the category is down 2% vs year ago in dollar sales. You can see that it’s manufacturers #2 and #4 that are driving results down. But when you look at the absolute $ change results, you can see that it’s actually manufacturer #2 that has lost significant sales that have negatively affected volume for the category. This is followed by Manufacturer #1 with -438 in sales, despite only a -1% decline in sales.

4. Drill down through the data using the following steps.
- Look at a topline level across the product groupings (e.g. Category, Manufacturer, Segments for latest 52 weeks).
- Compare against other measures (e.g. $ Volume vs Tonnage Volume vs Unit Volume) to see if there are any big differences that need to be understood (example you can look at Tonnage % Chg vs $ % Chg and if dollars grow at a slower pace than tonnage, it means there is deflation in the category).
- Compare to other time periods (e.g. 52 weeks vs 12 weeks vs 4 weeks) to identify shorter or longer-term trends or issues.
- Drill deeper into segments for a deeper understanding of what is driving results (e.g. by Family, Adult and Kids segments, and then Manufacturers within each segment).
5. Use benchmarks and comparisons for relevant insights.
Numbers are only numbers until you provide relative comparisons. For example,
- If a Retailer has a 25% share of market in a category, you can’t determine if that number is “good” or “bad” without comparing it to other related categories or comparing it to their all commodity volume (ACV) or all sales share.
- If a Retailer is flat in a category with 0% growth, by comparing it to the rest of market that is up 5% in the same category, the Retailer will be concerned that they are losing share in a growing pie.
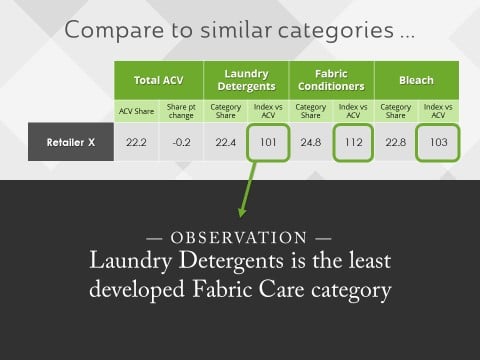
- If a Retailer has a 101 index vs ACV in Laundry Detergents, they may consider themselves to be well developed in the category. But if that index is compared with related categories (like Fabric Conditioners or Bleach) as in the following example, there’s an opportunity uncovered to increase development in Laundry Detergents for the Retailer.

Mastering the skills in analyzing data, like in the example I’ve provided for this Category Assessment, will prove invaluable to you now and in the future. Learning these foundations will help you make strategic, fact-based decisions that will drive your business and lead to improved business results.
Looking for more ways to effectively analyze data and derive strategic data insights? Category Management Knowledge Group can help you to move your team to the next level through custom category management training programs.
Check out our accredited course on “Completing a Category Assessment”, which gives an in-depth understanding of how to drill through data and derive insights. It focuses on a Retailer Category Assessment, but the learnings can be applied across many different analysis scenarios.
|
$125 USD 30-day Access Hands-On Downloadable Reference Guide Knowledge Checks Course Test |


