Learn how to assess the health of your category or brand to uncover new strategic business insights and opportunities!
A category or brand health assessment looks at the external environment in addition to internal, category and segment-specific measures. It should address questions like:
- What is happening with the Consumer / Shopper in the category or brand?
- How is the economic environment impacting business results?
- What trends are influencing this category (competitive, market)?
- What tactics are driving overall category results?
- Which activities should Start? Stop? Continue?
Too often we’re so caught up with looking at the business at a micro level that we forget to look from a bigger picture perspective – which is a great indicator of not only what’s happened in the past but gives a glimpse of the future from a bigger lens.
The opportunity? Complete a category or brand health assessment. By looking at your business using multi-dimensional factors that address the questions above, you will be able to unlock strategic business insights that give new areas of opportunity and understanding for your business.
Here are some resources to help you build your health assessment skills:
- Complimentary Download: Creating a Quadrant Analysis / Bubble Chart
- Course Video Preview: Category Health Assessment: Baseline and Incremental Drivers
- Course Overview: Category Health Assessment: Baseline and Incremental Drivers
4-Step Process to Measure Your Category or Brand Health
Following is a great 4-step process to assess your category or brand health. It is important to note that there are different perspectives that can be taken when completing a health assessment, based on different Retailer and Vendor perspectives.

- For the Retailer, their focus will be primarily on understanding how the category is performing for them versus the market, and what is driving these results.
- For the Vendor, the focus will be on the category when working directly with specific Retailers on Category Management projects, and their brands when interpreting their internal results. For their marketing team, they will focus primarily on brand or category health, depending on what they are looking for through their health assessment.
These different perspectives will drive different views of the data, but the overall flow and logic remains the same. I’m going to focus on the Retailer category perspective for the purposes of this blog.
1. Review Category Results
When completing an analysis on category growth, you should look across different measures (e.g. dollars, units, equivalized volume or tonnage, profit) in order to truly understand your category results. Following is a graph that shows some different scenarios that you may see in your data, as well as the interpretation of the different growth measure combinations:
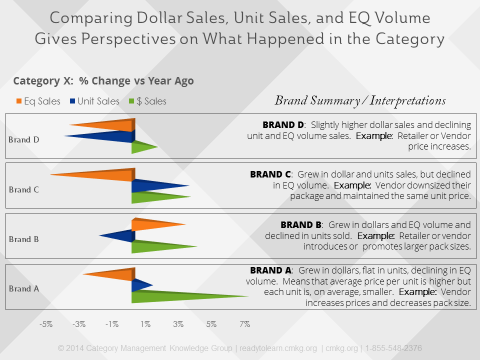
This is only a brand view, but Retailers should also look at their business across the most important subcategories based on the Shopper decision tree. Other things to include in the category assessment include:
- Trended results across different time periods (to uncover both short- and long-term trends);
- Seasonality analysis; and
- Market share development and trends (click here to learn how to create a great quadrant analysis / bubble chart).
Once again, these analytics should include different subcategory views based on what’s most important to the Shopper.
2. Understand Core Business Drivers
By core business drivers, I’m referring to the tactics, including product assortment, shelving, pricing and promotion. These tactics provide strategic insights that then create action in the category. Baseline and incremental sales are the best set of measures to understand which tactics are driving your business results. Anyone who is responsible for making decisions or recommendations on the tactics should be very well versed in understanding baseline sales vs incremental sales (click here to learn more about these two important measures).
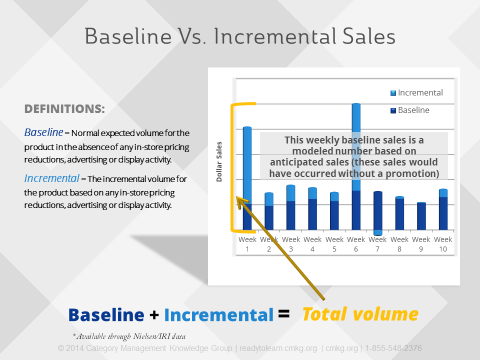
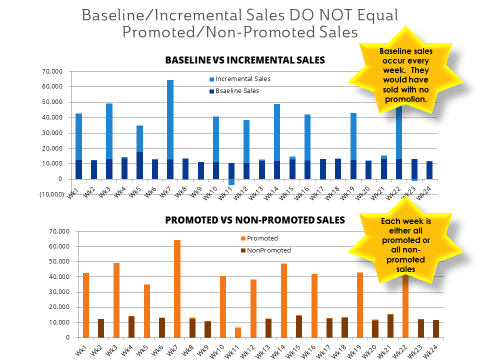
If you don’t have access to baseline and incremental sales, then your second option is promoted vs non-promoted sales (which is a much more limiting way to analyze tactical results). This is because weekly baseline sales + weekly incremental sales = weekly total volume, while weekly total volume is either all promoted sales or non-promoted sales (dependent on whether there was a promotion that week). See below for a good diagram to explain the difference:
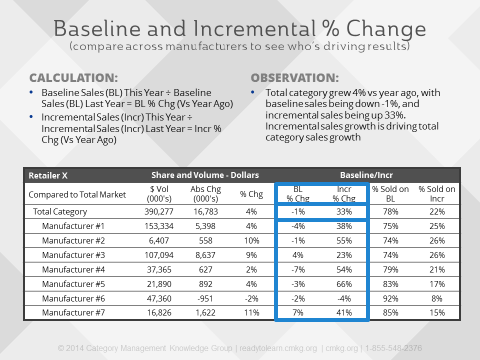
By adding in baseline and incremental sales results – including % growth and % sold on each – you can get a much better understanding of what’s driving your results. In the following chart you can see that the total category was up 4% in dollar sales, driven by all manufacturers except #4 and #6. When you break the results to Baseline/Incr, you can see that baseline sales are down 1% while incremental sales are up 33%. You can then look down the table to see what manufacturers drove these results. You can also see which manufacturers are most reliant on baseline and incremental sales (in this example, Manufacturers 1, 2 & 3 are most reliant on incremental sales).
The next step would be to drill deeper into each of baseline sales and incremental sales results for the category and subcategories including these examples:
BASELINE DRIVERS:
- Product Distribution (# items, total distribution points);
- Regular / Base Price;
- Shelving (share of shelf);
- New Product Launches (innovation share growth);
- Marketing and Direct Mail Campaigns (penetration, avg household expenditures; share of requirements)
INCREMENTAL DRIVERS:
- Ads, Circulars, Flyers, Promotions (% sold on promotion; # of flyers);
- Temporary Price Reduction (TPR) / Promoted Price (average TPR price; average promo price; % sold on ad vs TPR)
This last step is truly where the rubber meets the road—you may uncover some surprising things that you didn't know about your business. In net, baseline and incremental sales are incredibly powerful sources for understanding and giving perspective on which tactics are driving your overall business results.
3. Review Other Factors
It is important to also consider the Consumer and their shopping behavior. Because Consumer purchase behavior can be influenced by both pre-shopping decisions and decisions made in-store, it is difficult to correlate purchase behavior to either baseline or incremental sales. Consumer purchase behavior can be measured through transactional and loyalty data, as well as through panel data. Here’s an example of some panel data that shows consumer trends for a category:
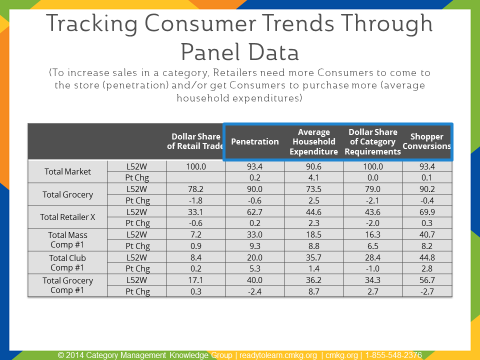
If this retailer wants to increase sales in a category, they either need to get more Consumers to the store to purchase the category, or get Shoppers who are already in the store to spend more dollars in the category. By measuring Penetration and Average Household Expenditures through Consumer panel data, it is possible to measure against two Consumer measures that drive volume.
Political, Environmental, and Economic trends can also play a significant role in a category’s health, and should be evaluated regularly. Any and all available resources should be used to enhance this area of understanding, including government statistics, media and news agencies, research and polling companies, and any other resources that are available. The Internet is a great source of information for understanding these types of trends.
4. SWOT Analysis
SWOT analysis is a well known planning tool. It helps to evaluate strengths, weaknesses, opportunities and threats in a business. This analysis is very effective when considering category health.
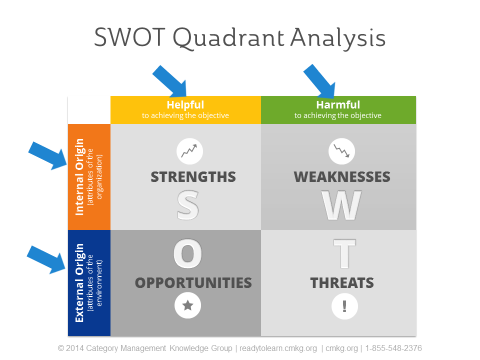
As you uncover key findings from your health assessment, you should capture them in a SWOT analysis based on if they are helpful or harmful to helping you achieve your objectives, and if they are driven from an internal or external origin. This allows you to formulate the bigger picture opportunities and priorities across all of the dimensions of your health assessment.
You should now have a better understanding of how to complete a health assessment – these four steps can be used for completing assessments from many different perspectives. By focusing across different dimensions you can uncover some compelling information about your business that you didn’t consider.
Never rely on only one data source, and don’t get caught up analyzing your data from a micro perspective. By “looking higher and broader” you can move to a new level of understanding and create action for your business.
I hope you found the 4 Steps to Uncover Strategic Business Insights useful!
Looking to build your assessment skills that incorporate different perspectives covered above? Category Management Knowledge Group can help you, your team or your organization learn more through a single course or a customized program. We have some great category management training options available to meet your needs.
Check out our accredited course on Category Health Assessment: Baseline and Incremental Drivers or watch a video preview of the course by clicking the graphic below.
|
$125 USD 30-day Access Hands-On Downloadable Reference Guide Knowledge Checks Course Test |


