
Retail POS (point of sale data) is the “king” of category management data. Are you maximizing the use of this important data source?
Retailer Scanned point of sale data and Retailer Measurement data from 3rd parties like Nielsen and IRI (key account data) are derived from scanned point of sale data. Together, these 2 variations of POS data are the primary data sources with which we do category management work.
These data sources provide a clear picture of sales, movement and tactical performance. They also give a real-time view of category performance and trends. Category management, sales and marketing professionals should have strong competencies with POS data, well beyond pulling and reading POS data.
Retailer Scanned sales contain a wealth of information, but the level of depth, types of reports and front-end systems are all driven by the Retailer. In order to have a strong, broad-based understanding of Retailer POS data, it’s important to focus on the key deliverables of the data. Extensive analytics can be done with this data.
Here are some resources to help you build your Retail POS analysis skills:
- Complimentary Download: Using Point of Sale Data to Analyze Out of Stocks
- Course Video Preview: Building Data Competency: Point of Sale (POS) Data
- Course Overview: Building Data Competency: Point of Sale (POS) Data
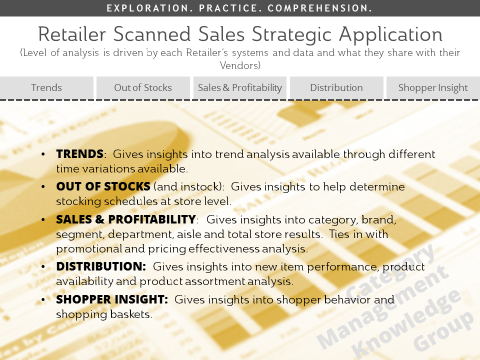
5 Ways to Analyze Your Retail Scanned Sales / Point of Sale Data
We are going to examine 5 ways to analyze Retailer Scanned Sales data with a few examples of analytics. They include:
1.TREND DATA – to leverage time variations in POS data for different perspectives
Retailer scanned sales systems usually allow for flexible, customizable views of time periods. These can include latest 52-, 26-, 12- and 4-week, fiscal year and calendar-year-to-date time periods plus comparison vs a year ago. It can also include 4 weekly seasonality trend analyses, daily analyses and even hourly results.
It is important for Retailers to monitor results through effective corporate reports and scorecards. Make sure that you are looking at both shorter- and longer-term trends when looking at your business. Shorter-term trends can proactively help you to fix issues before they extend into longer-term trends.
2. OUT OF STOCKS AND IN-STOCKS - to determine stocking schedules at store level

Out of Stock (OOS) lost sales are probably one of the most difficult things to measure (click here for Out of Stocks complimentary download). Hourly sales data with significant gaps would be a strong indicator of OOS issues, as would a significantly underdeveloped market share combined with full distribution. Looking at hourly data with sales gaps illustrates the power of hourly data. If you were to only look at average units per day, you would not see a difference between weekday and weekend sales. You would likely plan shelf capacity to these numbers. However, looking at sales per hour identifies an OOS issue during what should be a peak time for sales.
3. SALES AND PROFIT ANALYSIS - to understand brand, segment, category, department, aisle and total store results
In addition to standard sales measures like $ sales, unit sales and profit, retailer scanned data also allows you to track Same Store, or Comp Store Sales. “Comp Store Sales” is a measurement of productivity in revenue that is used to compare sales of retail stores that have been open for a year or more. Historical sales data allows Retailers to compare this year’s sales in their store to the same period last year. These measures allow Retailers to gauge how effective their programs are at driving organic growth vs growth from new store expansion.
4. DISTRIBUTION ANALYSIS – to track new items, product availability and product assortment
Tracking new items can be done easily and accurately by creating a report that tracks the percentage of stores selling an item. Here, distribution would only be recognized once the first sale is recorded.
The “% Stores with Sales” measure captures the percentage of stores that carry the item. An analysis like this gives a perspective on how quickly product is getting through the supply chain – from the warehouse, to the store’s receiving, then out from the backroom and onto the shelf. The flaw with measuring distribution this way is that if a product just isn’t selling, then it won’t be recorded. However, if a Retailer has a strategy of being first to market with hot new products, this will illustrate how well that strategy is being implemented through operations.
5. SHOPPER INSIGHT - to gain insights into Shopper behavior and shopping baskets
Basket analysis provides significant insight into the Shopper. Shopping baskets can be looked at in many different ways, and can be used to evaluate how well a retailer may be delivering against certain strategies. In the following example, a Retailer introduced a multiple purchase strategy – encouraging multiple purchase through “2 for” or “3 for” type incentives for consumers. They want to know if their strategy is successful based on this data.

By comparing the item quantity per basket for the current period when the new strategy was implemented, to the previous period, we can see if we are driving increased multiple purchases. This example shows a significant increase in the 2 and 3 item baskets, at 43 and 241% respectively, compared to the growth of total baskets at 15%.
Retailer scanned sales data can provide compelling insights. Because all categories are available all the way down to an item level, the analysis capabilities are unlimited! Scanned sales data allows for powerful, flexible analysis, including in-depth profit, promotion, pricing and assortment analysis, and shopping basket and loyalty analysis.
Looking to build your point of sale analysis skills? Category Management Knowledge Group can help you, your team or your organization learn more through a single course or a customized program. We have some great category management training options available to meet your needs.
Check out our accredited course on “Building Data Competency: Point of Sale (POS) Data” or watch a video preview of the course by clicking the graphic below.
|
$125 USD 30-day Access Hands-On Downloadable Reference Guide Knowledge Checks Course Test |

